
This post has already been read 9293 times!
After analyzing data for 1.75 million retail DC appointments on One Network’s Real Time Value Network, it became clear… the lack of On-Time In-Full (OTIF) performance was costing grocery retailers and their suppliers big time.
Our estimate is that the US grocery retailers hold $8-10 billion in excess inventory, due to the high supply variability caused by poor OTIF performance. As a result, the retailers have started to impose fine to suppliers and carriers, which could total up to $5-10 billion/year if the suppliers and carriers don’t deliver on time and in full within the retailer’s current OTIF policies. Either way, we estimate that it is a $10 billion problem that the retailers want to solve, either by greatly reducing the supply variability caused by poor OTIF performance, or by charging the suppliers or carriers for their lack of performance.
Many retailers and suppliers have an enterprise system in place to analyze their On-Time In-Full (OTIF) performance. The only problem is that they do not work. #logistics #retail #delivery Click To TweetThe Problem with OTIF Performance Solutions
Many retailers and suppliers have an enterprise system in place to analyze their OTIF performance. The problem with individual enterprise solutions is that:
- Each company leverages different data sets and captures a limited number of data points; and
- It does not promote a real time collaborative process to resolve the issues.
This makes it very difficult to (a) have a holistic shared view of OTIF performance across retailer, supplier and carriers, (b) acquire insights on the root causes when deliveries do not meet with OTIF requirements and (c) be able to systematically attribute the responsibility of the issues to either the retailer, the supplier or the carrier.
There is a simple solution to the problem.
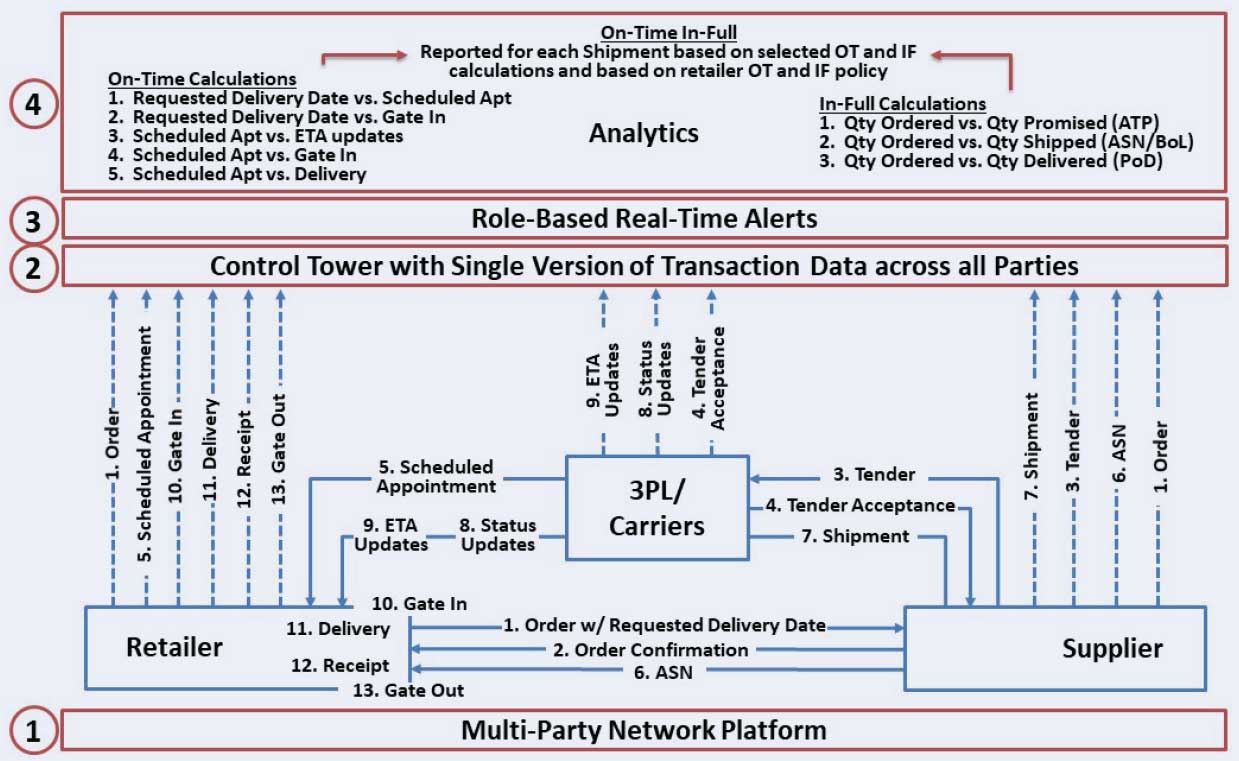
Retailers and suppliers can deploy a Control Tower that will (i) capture all the OTIF-related multi-party transactions on a single platform, (2) trigger the real-time alerts to monitor and resolve issues and (3) generate the analytics to calculate OT and IF for all shipments using common data and common metrics.
On-Time In-Full Control Tower for Grocery (and Others)
Let’s review these components.
1. Multi-Party Platform
First of all, OTIF is a process that involves multiple parties: a retailer, a supplier and a carrier (with the potential addition of a 3PL). It therefore makes common sense to monitor and optimize the OTIF process on a multi-party platform, not an enterprise platform. A fit-for-purpose multi-party platform will enable the retailers and suppliers to work together with their carriers across prepaid and collect shipments in order to monitor all OTIF transactions in real time, and collaborate across parties to improve the OTIF performance. Such a multi-party platform needs to be able to:
- Reconcile and synchronize all master data across all partners on the platform (multi-party master data management).
- Define security rules across all parties and roles at the data, workflow and UI levels (multi-party permission model).
- Integrate with all disconnected enterprise systems to mirror all point-to-point transactions on the platform, as a “single version of the truth”.
- Scale horizontally to be able to manage vast amount of data in real time.
2. OTIF Transactions
Second, let’s look at the OTIF transactions. A Control Tower acts as a “digital twin” of all the disconnected multi-party transactions that influence OT and IF. All the transactions depicted in the diagram above are mirrored onto the multi-party Control Tower to enable all parties to leverage a shared data set that captures the lifecycle of the orders and shipments. Once all the transactions are captured on the Control Tower, they become a “single version of the truth” across all the parties on the platform.
3. Role-Based Alerts
The third step is to generate the role-based alerts. All transactions (e.g. a shipment) are associated with their specific states (e.g. shipped, gated-in, delivered), and each state is associated with a specific tolerance level tied to the comparison between that state and the rule it needs to follow (e.g. comparing the retailers’ Requested Delivery Date to the Scheduled Appointment Date). Alerts are generated when the transaction states exceed the tolerance level for that state (e.g. the retailer allows a grace period of one day between Requested Delivery Date and Actual Delivery Date, so alerts will only be generated when the Scheduled Appointment Data is over one day late compared to the Requested Delivery Date). The alerts are pushed to role-based workbenches used by all the parties on the network, based on their role as defined by the multi-party security rules. The users can then review the alerts and collaborate across parties in real time to resolve these alerts.
4. OTIF Analytics
The fourth step is to leverage all the data on the Control Tower to build the OTIF analytics. The OT and IF performance analytics are calculated separately for each shipment, then aggregated together to determine whether the shipment was delivered on-time and in-full. Here is how it works:
- The OT metric can be calculated in multiple ways based on the data captured in the Control Tower, including (a) Requested Delivery Date vs. Scheduled Appointment Date, (b) Requested Delivery Date vs. Gate-In Date/Time, (c) Scheduled Appointment Date/Time vs. Gate-In Date/Time, (d) Scheduled Appointment Date/Time vs. Delivery Date/Time and (e) Scheduled Appointment Date/Time vs. Real-Time ETA Date/Time. The OT metric will capture the Reason Code associated with the transaction state if the shipment was not delivered on time. The Reason Codes will be inputted by the users when they manage the exceptions, and will determine which party is responsible for the late delivery. For example, a late delivery may be caused by a lack of retail DC dock capacity, a carrier problem or a late shipment from the supplier ship-from facility.
- The IF metric can be calculated by comparing the Quantity Ordered (as per the Retailer Order) with the Quantity Promised (as per the supplier’s ATP engine), the Quantity Shipped (as per the ASN or Bill of Lading) or the Quantity Delivered (as per the Proof of Delivery). As for the OT metric, the IF metric will also capture the Reason Code associated with the transaction state if the shipment was not delivered in full. The Reason Codes will be inputted by the users when they manage the exceptions, and will determine which party is responsible for the short delivery. For example, a short delivery may be caused by a short or incorrect shipment from the supplier or by damages caused by the carrier.
- The OTIF metric is then calculated for each shipment by combining both OT and IF metrics. The OTIF metric tells us whether the shipment was on-time and in-full, and, if not, what the quantity is that was not delivered on-time and in-full. The Reason Codes are captured with the OTIF metric to determine why the shipment was not on time and/or in full, and who is responsible for it.
- The OT, IF and OTIF metrics is highly configurable, based on the OTIF policies being tracked.
- Since all parties leverage the same platform, process, data and metrics, there is no need for time-consuming and disruptive reconciliations, claims and adjustments.
How will a Control Tower benefit both the retailers and suppliers?
The benefits for both retailers and suppliers are compelling.
Benefits for Retailers |
Benefits for Suppliers |
|
|
Based on these benefits, we fully expect the payback period of an OTIF Control Tower implementation to be less than 6 months.
- Automating Logistics with an Intelligent Logistics Network - January 31, 2020
- How Restaurant Companies Can Achieve Network Effect in 2020 - January 7, 2020
- How AI is Generating Value for US Restaurants - August 6, 2019