This post has already been read 20355 times!
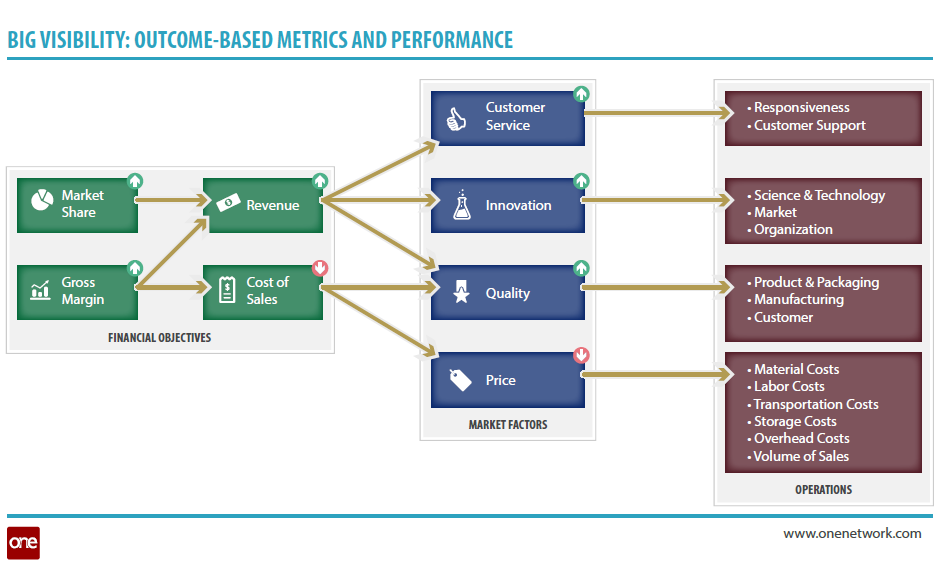
 Note: this is part 2 in a series of posts. In part one I laid out the 5 stage maturity model that shows how organizations can turn their “big data” into “big visibility”. The stages are 1) Representation; 2) Accessibility; 3) Intelligence; 4) Decision Management; 5) Outcome-Based Metrics and Performance. The fifth stage was so important, I promised to devote an entire post to it.
Here was the definition I used for Outcome-Based Metrics and Performance:
Achieving representation, accessibility, intelligence, and decision management enables the highest form of big visibility—outcome-based metrics and performance. A necessary outcome of our evolving supply chain networks will be to make sure we place the right assets in the right place at the right time in the right amounts, all bound by real time collaboration and big data visibility. Included in this evolution will be simultaneous efforts focused on organizational change, process reengineering, and lean/six sigma program management.
The fifth stage is where the concept of variation become very important. Variation is most likely the biggest cause for poor performance in any supply chain. All our calculations related to forecast accuracy, cycle stock, safety stock, order performance, order quantities, delivery performance, etc. are designed to accept variation and make allowances for it in our demand, material, and capacity performance. A typical multi-echelon, multi-partner global supply chain deployment is rife with variation in practice, measurement and decision making.
So what can we do about variation? W. Edwards Deming pointed out long ago that not only is variation the enemy of process improvement, but you must also be able to effectively measure a process to improve it. This is why descriptive analytics as well as more advanced predictive and prescriptive analytics can be crucial, as they can help to identify root cause related to process variation. Furthermore, a properly designed workbench allows users at various levels within an organization to gain visibility to both process performance and process outcomes, as well as execute actions to improve both the process design itself and the outcomes it generates.
Given the data and technology available today, we now have the power to significantly reduce variation. I mentioned last time that based on some of the clients I’ve worked with at One Network it has the potential to drive up to a 4% increase in sales, a 10% reduction in operating expense, and a 30% reduction in inventory!
It would be poor form not to attack variation with renewed vigor, challenging concepts hardened by the dominant ERP architectures of today.
If you’re interested in this topic, I suggest you read the recently released whitepaper, “Turning Big Data into Big Visibility“.
- Map of U.S. Trucking Spills in 2016 - January 13, 2017
- What is aPaaS? A Way to Supercharge Your App Development - December 12, 2016
- Future of Transportation: Goodyear’s Radical Smart Tire Concept - November 3, 2016

